Page 3
Evaluating Linear Functions
Domain and Range
The image below gives a nice and concise explanation of how to define the domain (x) and range (y) of a function when it's graphed.
This has the domain and range defined as a set. Make note of the notation used.
*** Don't worry about where it says "x ∈ ℝ" at the end. We don't need to worry about that!
*** Don't worry about where it says "x ∈ ℝ" at the end. We don't need to worry about that!
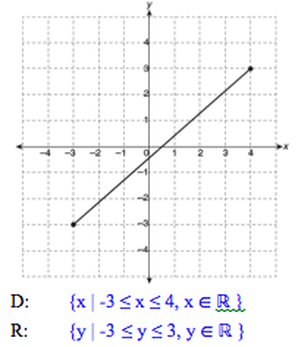
Focus more on the domain and less on the range. Determining the range can be tricky, but we care more about the domain right now.
|
|
|
DESMOS: Finding Domain and Range (Code: XXXX)
- Initially with graphs, then going more abstract
DESMOS: Domain and Range Lab (Code: XXXX)
- Initially with graphs, then going more abstract
DESMOS: Domain and Range Lab (Code: XXXX)
Evaluating Functions
The first video is only 1 minute long! With the second video, you can stop when he talks about finding g(2x+3). We don't get into that in Integrated 1.
|
|
|
The 10 Features of a Function
DOMAIN: from the farthest left to the farthest right
RANGE: from the lowest to the highest
POSITIVE OUTPUT: wherever the graph is above the x-axis
NEGATIVE OUTPUT: wherever the graph is below the x-axis
INCREASING: wherever the graph is going up (when the y-values are increasing)
DECREASING: wherever the graph is going down (when the y-values are going down)
X-INTERCEPT: wherever the function line crosses the x-axis
Y-INTERCEPT: wherever the function line crosses the y-axis
MAXIMUM: the highest point of the function
MINIMUM: the lowest point of the function
Function Notation (Inequality vs. Interval Notation)
COOL MATH has a really great explanation of interval notation. Look at Pages 1, 2, and 3. (We won't deal with Page 4's Unions just yet, but it wouldn't hurt to explore!)
BE CAREFUL, because this can get super confusing.
You're used to interpreting (3,6) as a single point on a graph. Now, though, it can also be used to represent an interval. Whereas in inequality notation, we would use a <, in interval notation we use a (. If we wanted to use a ≤, we would not use a [.
< ≤ ≥ > are inequality symbols
( ) are parentheses
[ ] are brackets
Like in the example above, -∞ < x ≤ 2 would be read as "negative infinity is less than x is less than or equal to 2"...we're conveying the idea that x can be any number smaller than (and including) 2.
If I wanted to convey the idea of a domain being { x | -9 ≤ x ≤ 10 }, I can write that in interval notation as [-9,10]. I use brackets because x could be -9 or it could be 10.
If I wanted to convey the idea of an interval being -9 < x < 10, I would write that in interval notation as (-9,10). I use parentheses because x could not be -9 or 10...it could be -8.9999 or 9.9999 or anywhere in between!
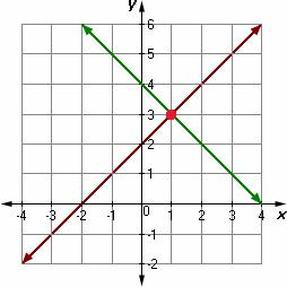
Systems and their Solutions
|
|
In the graph above, the blue line can be described as c(x) = 2x + 1.
The red line can be described as d(x) = -x + 7.
They intersect at the point (2,5) which means that c(2) = 5 and d(2) = 5.
We can describe this in a few ways:
(1) c(x) = d(x) when x = 2.
(2) c(2) = d(2) = 5
(3) The functions c and d have the same input and the same output at exactly one moment in time.
Mathematically, when x = 2 (input), y = 5 (output) for both functions.
Now, suppose that the x axis measured days and the y-axis measured money.
Suppose that c(x) described the money that Cristhian makes after x days.
Suppose that d(x) described the money that Dav'Richa makes after x days.
Contextually, it would mean that after 2 days, Cristhian and Dav'Richa both made $7.
There would be no other instance when, after the same amount of time, the two made the same amount of money.
