Page 8
Systems of Inequalities
Graphing Inequalities
|
All equations & inequalities must be in Y = M X + B form first! To get into Y=MX+B form, subtract the x-term from both sides, then divide all terms by the coefficient of y. • Start at the y-intercept (on the y-axis). • Move according to slope (rise/run). Turn integers into fractions. • If the inequality symbol is ≤ or ≥ then draw a solid line. • If the inequality symbol is < or > then draw a dotted line. • If the inequality begins y < or y ≤, shade under the line. • If the inequality begins y > or y ≥ shade above the line. • The line x = 4 is a VERTICAL line through 4 on the x-axis. • The line y = 3 is a HORIZONTAL line through 3 on the y-axis. |
|
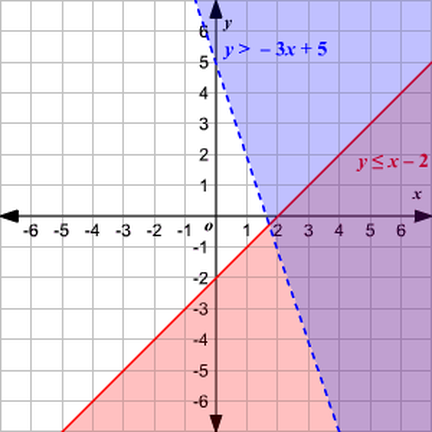
Graphing Systems of Inequalities
|
The red line is SOLID because of ≤ includes "equals". The red line is shaded UNDER because ≤ includes "less than". The blue line is DOTTED because > does NOT include "equals". The blue line is shaded ABOVE because > includes "greater than". The red section only applies to the inequality y ≤ x - 2 The blue section only applies to the inequality y > -3x + 5 The purple section applies to both inequalities, and thus is the solution to the system. |
|
